|
Where Do People Buy Food in Lexington?
According
 to the Economic Census to the Economic Census
published
by U.S. Census Bureau,in Lexington-Fayette County, there were 74
“grocery stores” in 2002. Despite a 10,277(or 4 percent) population
increase during that period, this was 14 fewer than the 88 stores
counted in 1997. Aside from the issue of fewer stores serving more
people, there is the question: “Are grocery stores geographically
distributed in a way that serves every Lexington resident?”
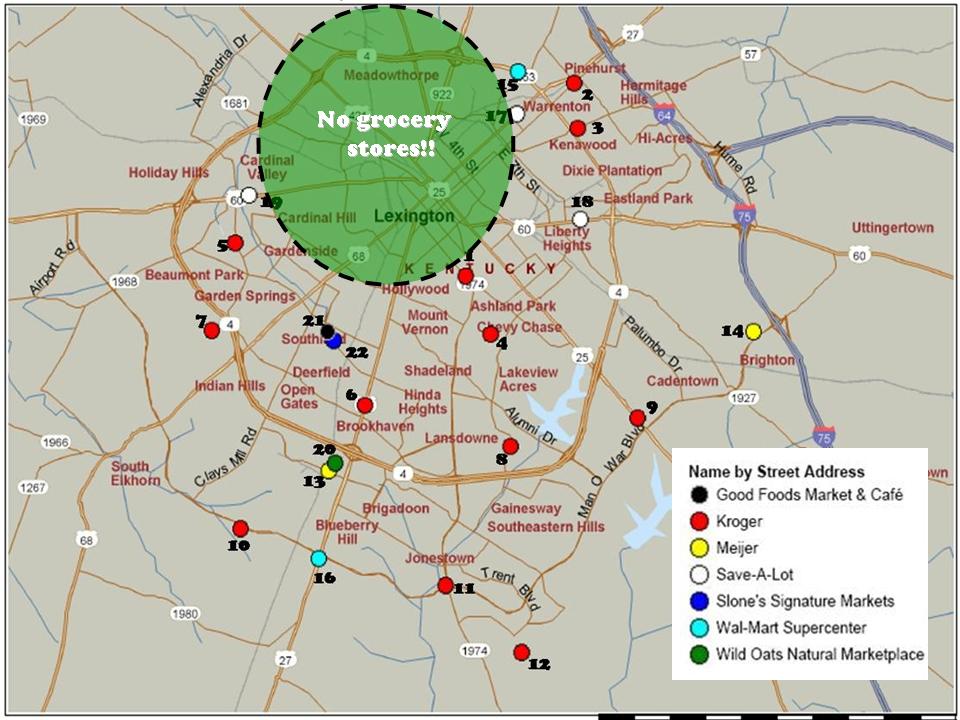
Let’s take a look at some maps
to find out where food retail outlets are located.
Map of “Supermarkets” in Lexington
·
·

·
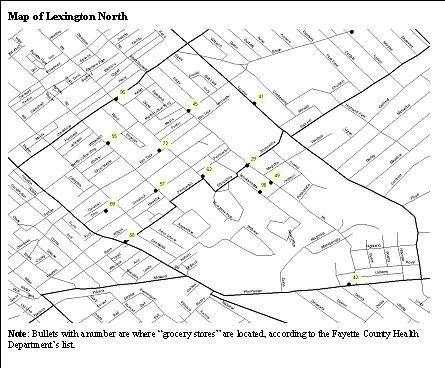
Map of “Grocery Stores” in Lexington

Food Insecurity in Lexington
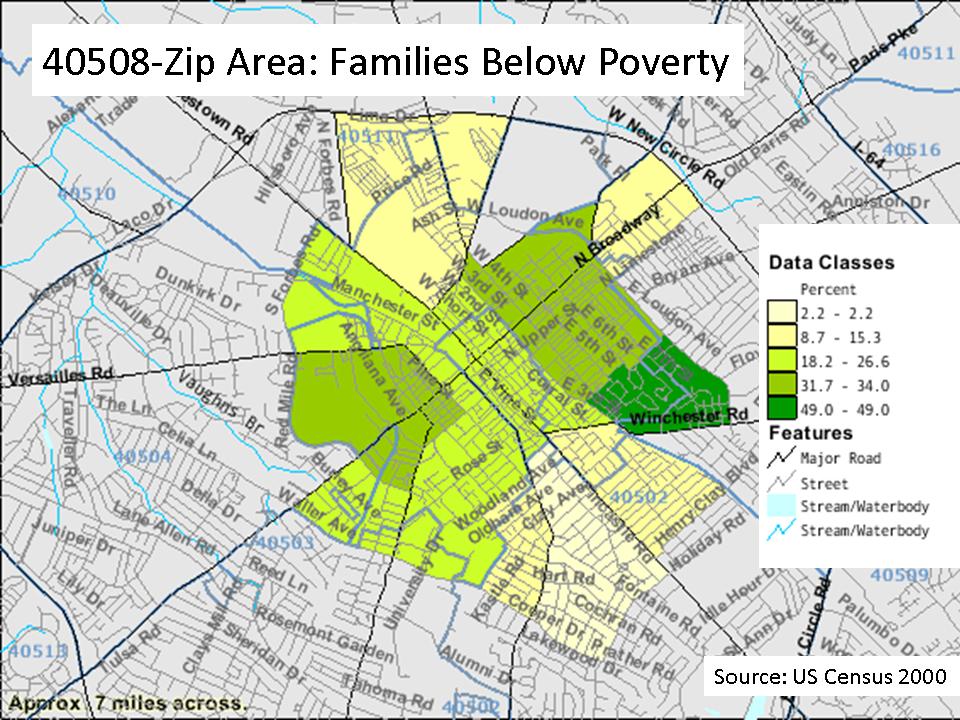
According to the 2000 U.S.
Census, the region with the 40508-zip code has the highest percentage of
households within Lexington who live below poverty (U.S. Census Bureau
2000). As shown below, 36% of God’s Pantry’s clients in 2007 come from
the 40508-zip code region (God’s Pantry Food Bank 2007). During the
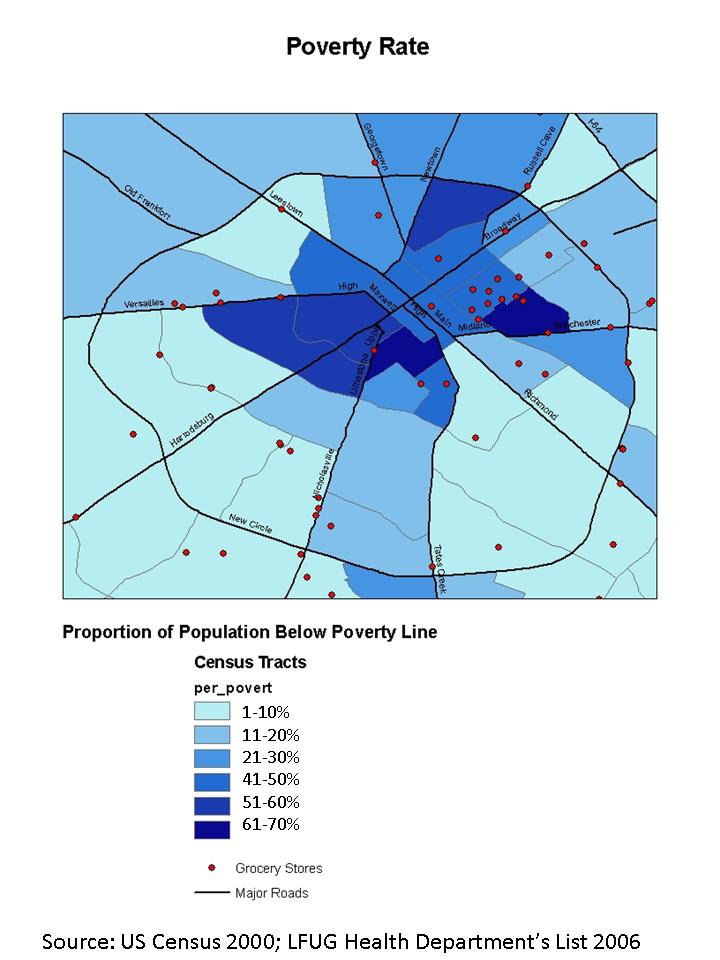
summer of 2006, we obtained the list of active establishments inspected
by the Fayette County Health Department. Among those establishments,
food retailers, excluding eateries, are mapped using the Geographic
Information System (GIS), food retailers. The spatial distribution of
food retailers in Lexington were combined with basic demographic data
from the 2000 U.S. Census.

Map of Family Poverty in the 40508 Zip-Area
·

Map
of Family Poverty in Lexington

Map of African-American Population in Lexington

Case Study:
Lexington North vs. Lexington South
In Fall 2006, seven graduate students in
SOC517: Rural Sociology were divided into two groups to conduct
case studies of two areas, (a) Lexington North and (b) Lexington South.
These two case areas have the highest rates of poverty within the 40508
zip region.

Sources: US Census Bureau
(2000), LFUCG Health Department (2006)
Lexington North Area
encompasses census tracts 3 and 4. Bordered by North Limestone, East
Loudon, Winchester Road, and East 3rd Street, the population of this
area is roughly 6,000. It can be best characterized by its
proportionally high percentage of Blacks (62%), relatively low rate of
vehicle ownership (65%), and widespread poverty. With the poverty rate
at 43%, and the medium income slightly over $16,500, this neighborhood
is one of Lexington-Fayette’s most impoverished areas. According to the
list of Fayette Health Department, there are 10 “grocery stores” in the
census tract 3 and three in the tract 4. The intensity of poverty in the
latter track appears to be higher than in the former.
Comparison of Demographic
Characteristics Between Two Census Tracts in Lexington North, 2000.
|
Lexington
North ID |
Population |
Black
% |
Hispanic
% |
Median Income |
Poverty
% |
Without
Vehicle |
|
Tract 3 |
3,345 |
64 |
6 |
19,355 |
34 |
28 |
|
Tract 4 |
2,383 |
59 |
4 |
13,750 |
52 |
42 |
Source: U.S. Census Bureau (2000)

Lexington South Area
encompasses census tracts 9, 18 and 19 within the 40508-zip code region.
This area was selected because the average median income of the three
census tracts ranked the second lowest ($17,761) within Lexington.
Comparison of Demographic
Characteristics Between Two Census Tracts in Lexington South, 2000.
|
Lexington
North ID |
Population |
Black
% |
Hispanic
% |
Median Income |
Poverty
% |
Without
Vehicle |
|
Tract 9 |
2,475 |
22 |
3 |
$17,111 |
47 |
13 |
|
Tract 18 |
2,715 |
6 |
2 |
$15,445 |
45 |
13 |
|
Tract 19 |
4,266 |
20 |
4 |
$20,727 |
42 |
12 |
Source: U.S. Census Bureau (2000)

However, Lexington South is
distinctively different from Lexington North. Although 45 percent of the
9,500 residents of this area live in poverty, only 13 percent of the
households live without a car, which is relatively low compared with
other areas with high poverty rates in Lexington. This area is unique in
that it borders the University of Kentucky campus. It is likely that a
large proportion of the residents in this area are students. This
partially explains a relatively high level of residents with a vehicle.
Moreover, the area is very diverse in the socioeconomic status of the
population. Geographically, the area can be generally described as a pie
shaped segment bordered by Mason Headley Road on its southern boundary,
Versailles Road and West High Street on its western boundary and West
Maxwell Street on its northernmost boundary. From West Maxwell, the
eastern boundary runs south on South Limestone, west on Virginia Avenue
and then south on South Broadway until Mason Headley Road is reached.
Two very large recreational sites, the Picadome Public Golf Course and
the Red Mile horse race track dominate the southernmost segments of this
area.
Community Food Mapping was
conducted in the two case areas, in which a total of 90 food
establishments were found.
Mapping of Food
Establishments in Lexington North and Lexington South,
October 2007.
|
|
North |
South |
|
Grocery Stores |
16 |
2 |
|
Convenient Stores1
|
4 |
13 |
|
Liquor Stores |
3 |
3 |
|
Restaurants |
15 |
33 |
|
Fast-food Restaurants
|
5 |
26 |
|
Others |
4 |
13 |
|
TOTAL |
47 |
90 |
Note:
1. Gas stations are included in this category.
In
Lexington South, many of restaurants and fast-food restaurants, and
convenient stores are located on S. Broadway Rd. and Versailles Rd. Two
“grocery stores” are small with an extremely limited selection of food;
ordinary residents would not likely recognize them as “grocery stores.”
Many food establishments in the South area are likely accessible only by
customers with a vehicle. Compared to the South area, the North area
appears to be served well by 16 grocery stores. Many of these stores are
located within a walking distance. However, these stores are small
corner stores with limited selection.
|